Supernova in VR
Volume and surface rendering supernova data using virtual reality technology
Role
C++ engineer
Advisors
Kim Arcand, Tom Tsgouros
Tools
C++, VTK, MinVR
Timeline
- hrs. June 2017-Present
Results
Interactive renderings of Cas. A
The summer after my sophomore year, I worked with NASA's Visualization Lead Kim Arcand to produce interactive visualizations of the supernova remnant Cassiopeia A.
Given volumetric and polygonal data on the supernova remnant Cassiopeia A collected by NASA’s Chandra satellite, my research project employs volume and surface rendering techniques using Visualization Toolkit (VTK) to create a program enabled with VR technology.
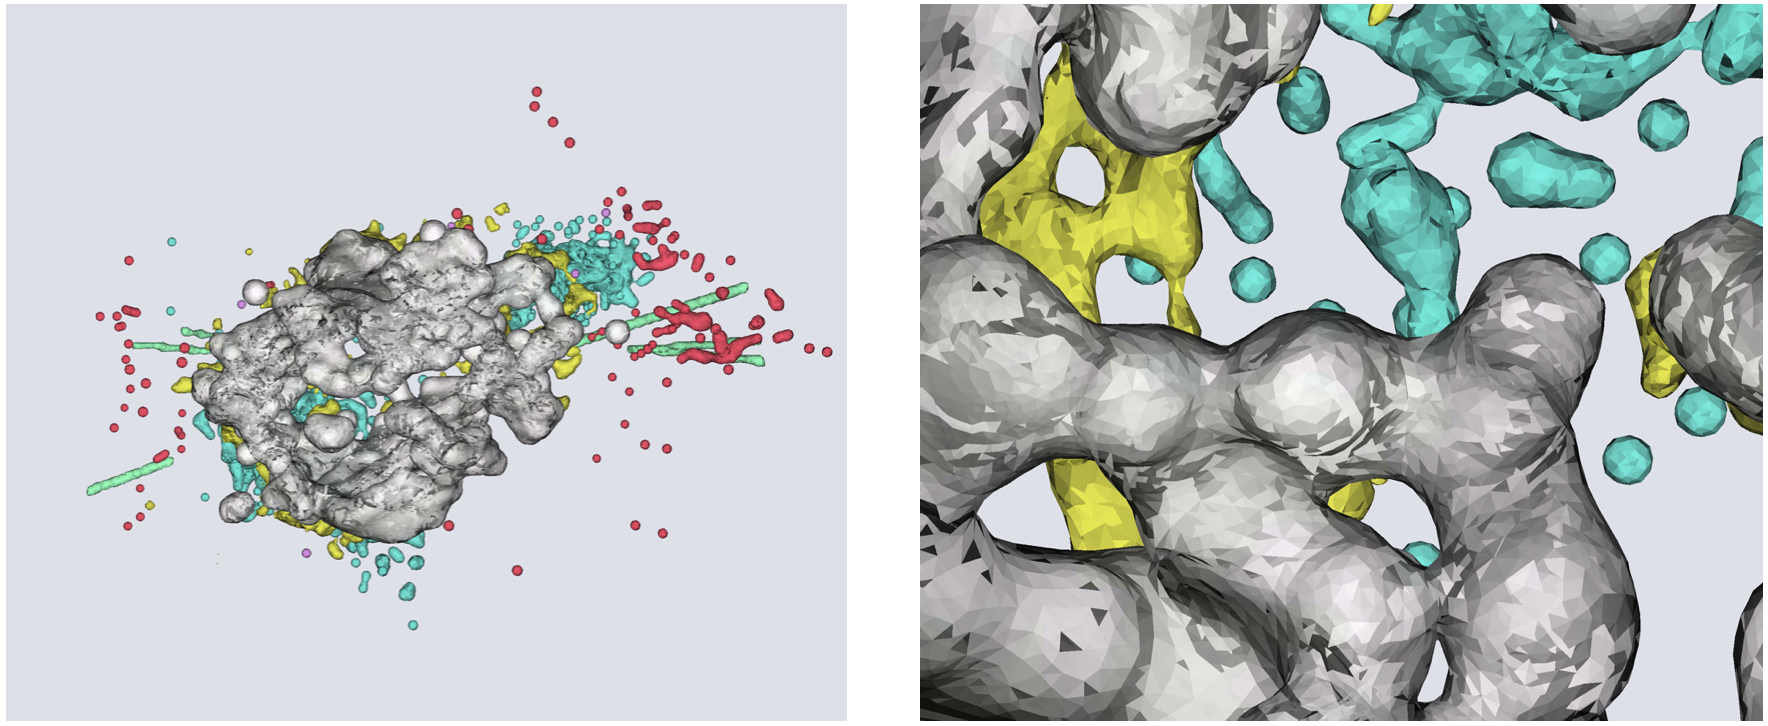
As of August 2017, I have produced a surface rendering and a sample volume rendering of Cas. A that can be displayed in Brown's Yurt Ultimate Reality Theatre (YURT). I have also a received a NASA grant to continue adding features to the renderings over the next two semesters.
Final Product

Credit: NASA
Hello, Space Traveller!
This 3D visualization – the first ever of its kind -of one such supernova, Cassiopeia A (Cas A for short), is based on real data from multiple telescopes giving us a chance to explore a fascinating and important process like never before. The positions of these points in three-dimensional space were found by using the Doppler effect and simple assumptions about the supernova explosion.
When elements created inside a supernova like Cas A, such as iron, silicon and argon are heated they give off light at certain wavelengths. Material moving towards the observer will have shorter wavelengths and material moving away will have longer wavelengths. Since the amount of the wavelength shift is related to the speed of motion, we can determine how fast the debris are moving in either direction. Because Cas A is the result of an explosion, the stellar debris are expanding radially outwards from the explosion center.
In this visualization, we are looking at X-ray data from NASA’s Chandra X-ray Observatory, infrared data from the Spitzer Space Telescope and optical data from NOAO's 4-meter telescope at Kitt Peak and the Michigan-Dartmouth-MIT 2.4-meter telescope. The green region is mostly iron observed in X-rays. The yellow region is silicon seen in X-rays, optical, and infrared. Outer debris seen in the optical is shown in cyan. The red region is Argon seen in the infrared. The blue reveals the outer blast wave, most prominently detected in X-rays. In magenta is Neon as seen in infrared wavelengths. In purple, two jets of material are seen. These jets funnel material and energy during and after the explosion.
Chandra observed mostly iron, silicon, and the outer blastwave. Spitzer observed mostly silicon, argon, and neon. Optical telescopes observed mostly silicon, and outer debris. Jets have been detected in X-ray, and also infrared and optical emission.
Demo
Rendering Data with Virtual Reality: a Background
Currently, virtual reality software has not been standardized to the point in which we can use data as direct input into a VR program. While software exists that allows visualizations to be displayed across different platforms (caves, PowerWalls, 3DTVs, head-mounted displays) using a variety of input devices (6 degree-of-freedom trackers, multi-touch input devices, haptic devices), we have yet to design a system that can support raw data without any external software. Therefore, with each new type of dataset, effort must be made to build the bridge between raw data and VR software in order to produce a visualization.

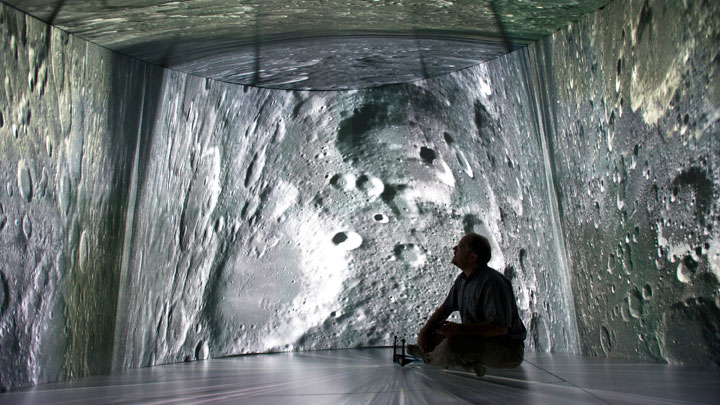
David Laidlaw, Professor of Computer Science at Brown's Yurt Ultimate Reality Theater
Credit: Brown University
Aims of this research project:
To help Kim Arcand, NASA’s Chandra X-ray Observatory researcher, convert volumetric and surface data into 3D models that can be observed with VR software
To design the ‘glue’ between many types of raw data and MinVR so that future virtual reality researchers and scientists can use this program to immediately render and visualize their datasets.
LONG TERM PROJECT GOAL
Build a generic program between raw data and VR technology that can be used in future scientific research.
Methods and Models
Surface and Volume Rendering
To render the supernova both volumetrically and polygonally, I used VTK, an open-source, freely available software system for 3D computer graphics, image processing, and visualization. VTK supports a wide variety of visualization algorithms including scalar, vector, tensor, texture, and volumetric methods, as well as advanced modeling techniques such as implicit modeling, polygon reduction, mesh smoothing, and contouring. VTK has an suite of 3D interaction widgets. With VTK, I was able to read in the supernova datasets and use its built-in filters and mappers to render the remnant’s volume and surface. The remnant is composed of seven different parts, and each part is represented by a different color in the surface model.
Integrating with MinVR
MinVR is an open-source project developed and maintained collectively by a few universities across the nation, including Brown University. It aims to support data visualization and virtual reality research projects through providing a cross-platform VR toolkit that can be used in many different VR displays, including Brown University’s YURT (Yurt Ultimate Reality Theatre).
The challenge of this project was integrating the VTK program with MinVR. Since both programs had their own render function, we had to use VTK’s external module to allow the VTK program to accept an external render window and render loop. The external module of VTK is rarely touched, and thus I identified a few bugs along the way that prevented the external camera from working with VTK objects. In the end, I was able to complete the integration and display the supernova models in Brown's YURT Ultimate Reality Theatre.

The model above is a surface rendering of Cas. A, which is made up of 7 different parts, as shown in different colors. Each part is a separate ASCII data file consisting of polygonal data and triangular strips.
The 7 parts of Cas. A include a spherical component (purple), a tilted thick disk (gray), and multiple ejecta jets/pistons (green) and optical fast-moving knots (red, yellow, blue, pink) all populating the thick disk plane.

Left: a sample volume rendering of Cas. A using iron density data; Center: a volume rendering with low opacity levels; Right: a volume rendering with high opacity levels
The model pictured above is a sample volume rendering demo that uses iron density data to simulate what a supernova would look like given its volumetric data. When the opacity level is low enough (middle image), one can observe an outer cube that encompasses the iron density data, illustrating the importance of adjusting opacity levels when volume rendering. On the other hand, when the opacity level is too high (right image), we cannot see enough of the data to observe the differing measurements of density. A major part of volume rendering is finding that optimal opacity level along with an intuitive color scale.
Next Steps
Further Interactivity
While the results I have reached right now produce interactive renderings of the supernova remnant, I hope to expand upon this program to ultimately build animations that illustrate the life of a star, from birth to death with further interactivity included in it. I aim to include annotations for the different parts of the supernova to describe its components and its structure. Users will be able to select a specific part of the supernova using their input device or wand to access the annotations. These additional features will allow educators to effectively tell the story of a star, and provide resources for researchers to observe closely the changes in size, density, and shape of a star across time.
Volumetric Data
As of now, I have produced a sample volume rendering of a supernova using iron density data. We are currently waiting to receive the volumetric data files of Cassiopeia A from NASA. This will allow us to potentially merge the volumetric and surface renderings to create a more comprehensive model of the supernova.
Beyond Supernovas
Through rendering 3D models of Cassiopeia A, this project has in addition implemented a generic program with demos and examples of how to easily create similar programs to read in and display data. In the future, we should be able to demo models of the supernova 1987A, black holes, and other density data with much less effort. Our hope is that this generic program will act as a skeleton and tutorial for future data sets in biomedical fields, physical fields, and more.
Acknowledgements
Special thanks to my advisor and boss, Tom Sgouros, for his guidance and encouragement throughout the past 10 weeks.
Thank you to NASA’s Visualization Lead Kim Arcand for providing me with this unique opportunity to work with NASA on bringing VR technology to researchers and educators.
